← Back to blog # How to Use the Apify MCP in Claude to Cross-Reference Spanish Mortgage and Foreclosure Data from the INE
Learn how to connect the Apify MCP to Claude and use the legaltech/ine actor to cross-reference Spain’s Mortgage Statistics and Mortgage Foreclosure Statistics from the INE, and reach the provincial figure no article publishes.
Before diving in, a caveat: the `legaltech/ine` actor isn't a strictly "legal" connector — it doesn't query case law, legislation, or legal databases, but official statistics from Spain's National Statistics Institute (INE). Still, having direct access to that social and economic data is also an advantage for anyone practicing law. Legal reality is, almost always, the consequence of a prior social reality: a mortgage foreclosure doesn't appear out of nowhere — it appears because a given territory signed a large number of mortgages during an expansion period, and some of them later stopped being paid. Understanding that statistical backdrop — how many mortgages are behind it, how it evolves, which provinces concentrate the foreclosures — gives context to a specific case or legal problem that no legal search engine will give you.
Every month, Spain's National Statistics Institute (INE) publishes two separate statistics: **mortgages granted** (how many are signed) and **mortgage foreclosures** (how many end up in a judicial procedure). Each lives in its own statistical operation, with its own tables and its own codes. Cross-referencing them — by province, by year, working out how many foreclosures get registered for every new mortgage in a region — isn't something you can ask a search engine for: it's a calculation you have to assemble yourself, table by table. In this guide you'll see how the **Apify MCP**, connected to **Claude**, does that cross-reference for you — and we'll use the INE's own data to build the charts in this article.
## 📊 What Does the `legaltech/ine` Actor Do (and What Isn't It For)?
The [`legaltech/ine`](https://apify.com/legaltech/ine?fpr=legaltech) actor is a natural-language semantic layer on top of the INE's full catalog, including the **Mortgage Statistics (HPT)** and the **Mortgage Foreclosure Statistics (EH)**. The workflow always follows the same steps:
1. **Search** for the table or statistical operation from your question, combining the actor's internal catalog with the INE's own search engine.
2. **Inspect** that table's dimensions (province, property type, holder type, period...) and the values available for each one.
3. **Filter and extract** the numeric data, with stable links back to the source so you can cite it.
If you ask it how many mortgages were signed in Spain last month, you'll get an answer, but that figure is already in the INE's monthly press release and in dozens of financial outlets that summarize it the same day — that's not where the actor adds the most value. Where it really shines is the cross-reference nobody has done for you: taking the mortgage table and the foreclosure table, aligning them by province and year, and computing a ratio that's much harder to find already published because it requires combining two separate statistical operations.
## 🔍 The Real Use Case: A Ratio You'll Rarely Find Already Calculated
The starting question is this:
> **In 2024, how many mortgage foreclosures were registered in each province for every 100 mortgages granted that same year?**
This figure is hard to find already worked out by province. Media coverage sticks to national headlines ("mortgage foreclosures fall X% year-on-year") or, at best, a one-off ranking using whatever data was available the year the article was written. But the ratio of *foreclosures per 100 new mortgages*, province by province and updated to the latest available data, is a good example of a figure you can only get by cross-referencing two INE tables that don't share an operation or a code:
**1.** Filtering the Mortgage Statistics table by province and summing the twelve monthly series for 2024 gives you the number of mortgages granted.
**2.** Filtering the Mortgage Foreclosure Statistics table with the same province and year filter gives you the number of foreclosures initiated and registered in the property registry.
**3.** Dividing the second figure by the first, province by province, produces a number that's in no article anywhere: the relative weight of foreclosure against new credit in each territory.
*Note: mortgages and foreclosures are counted in the same time window (2024 against 2024), but no individual mortgage is tracked over the following years to see whether it ends in foreclosure — these are two independent counts for the same period, not the same cohort of loans. The denominator (new mortgages) has no causal link to foreclosures: it's only a yardstick used to normalize for the size of each province's mortgage market, the same way you could normalize by population instead. That's why this calculation is an indicator of litigation pressure relative to the size of that year's mortgage market — useful for comparing provinces against each other, or the same province over time — not a delinquency rate for mortgages signed in 2024, nor a predictor of future foreclosures. And if a province's volume of new mortgages swings a lot from one year to the next (a rate cut, say), the ratio will move for that reason alone, even if foreclosures — which trail years behind — haven't changed.*
Here's the aggregated national series for 2014-2025 — the starting point before drilling into the provincial detail:
<div style="border:3px solid #000;border-radius:12px;padding:22px 20px 18px;background:#fff;margin:26px 0;overflow-x:auto;">
<div style="font-family:'IBM Plex Mono',monospace;font-size:11px;letter-spacing:.08em;text-transform:uppercase;color:#6b6558;margin-bottom:4px;">National series · 2014–2025</div>
<div style="font-weight:700;font-size:16px;margin-bottom:4px;color:#1a2332;">Mortgage foreclosures initiated and registered</div>
<div style="font-size:12px;color:#6b6558;margin-bottom:16px;">Down 84% from the crisis peak to the 2023 low</div>
<div style="display:flex;align-items:flex-end;gap:6px;min-width:560px;">
<div style="flex:1;display:flex;flex-direction:column;align-items:center;"><div style="font-size:9.5px;font-family:'IBM Plex Mono',monospace;color:#1a2332;margin-bottom:4px;">120,539</div><div style="width:70%;height:150px;background:#b5432a;border-radius:3px 3px 0 0;"></div><div style="font-size:9.5px;font-family:'IBM Plex Mono',monospace;color:#6b6558;margin-top:6px;">2014</div></div>
<div style="flex:1;display:flex;flex-direction:column;align-items:center;"><div style="font-size:9.5px;font-family:'IBM Plex Mono',monospace;color:#1a2332;margin-bottom:4px;">102,477</div><div style="width:70%;height:128px;background:#b5432a;border-radius:3px 3px 0 0;"></div><div style="font-size:9.5px;font-family:'IBM Plex Mono',monospace;color:#6b6558;margin-top:6px;">2015</div></div>
<div style="flex:1;display:flex;flex-direction:column;align-items:center;"><div style="font-size:9.5px;font-family:'IBM Plex Mono',monospace;color:#1a2332;margin-bottom:4px;">73,104</div><div style="width:70%;height:91px;background:#b5432a;border-radius:3px 3px 0 0;"></div><div style="font-size:9.5px;font-family:'IBM Plex Mono',monospace;color:#6b6558;margin-top:6px;">2016</div></div>
<div style="flex:1;display:flex;flex-direction:column;align-items:center;"><div style="font-size:9.5px;font-family:'IBM Plex Mono',monospace;color:#1a2332;margin-bottom:4px;">53,010</div><div style="width:70%;height:66px;background:#b5432a;border-radius:3px 3px 0 0;"></div><div style="font-size:9.5px;font-family:'IBM Plex Mono',monospace;color:#6b6558;margin-top:6px;">2017</div></div>
<div style="flex:1;display:flex;flex-direction:column;align-items:center;"><div style="font-size:9.5px;font-family:'IBM Plex Mono',monospace;color:#1a2332;margin-bottom:4px;">54,764</div><div style="width:70%;height:68px;background:#b5432a;border-radius:3px 3px 0 0;"></div><div style="font-size:9.5px;font-family:'IBM Plex Mono',monospace;color:#6b6558;margin-top:6px;">2018</div></div>
<div style="flex:1;display:flex;flex-direction:column;align-items:center;"><div style="font-size:9.5px;font-family:'IBM Plex Mono',monospace;color:#1a2332;margin-bottom:4px;">56,787</div><div style="width:70%;height:71px;background:#b5432a;border-radius:3px 3px 0 0;"></div><div style="font-size:9.5px;font-family:'IBM Plex Mono',monospace;color:#6b6558;margin-top:6px;">2019</div></div>
<div style="flex:1;display:flex;flex-direction:column;align-items:center;"><div style="font-size:9.5px;font-family:'IBM Plex Mono',monospace;color:#1a2332;margin-bottom:4px;">34,983</div><div style="width:70%;height:44px;background:#b5432a;border-radius:3px 3px 0 0;"></div><div style="font-size:9.5px;font-family:'IBM Plex Mono',monospace;color:#6b6558;margin-top:6px;">2020</div></div>
<div style="flex:1;display:flex;flex-direction:column;align-items:center;"><div style="font-size:9.5px;font-family:'IBM Plex Mono',monospace;color:#1a2332;margin-bottom:4px;">32,881</div><div style="width:70%;height:41px;background:#b5432a;border-radius:3px 3px 0 0;"></div><div style="font-size:9.5px;font-family:'IBM Plex Mono',monospace;color:#6b6558;margin-top:6px;">2021</div></div>
<div style="flex:1;display:flex;flex-direction:column;align-items:center;"><div style="font-size:9.5px;font-family:'IBM Plex Mono',monospace;color:#1a2332;margin-bottom:4px;">26,306</div><div style="width:70%;height:33px;background:#b5432a;border-radius:3px 3px 0 0;"></div><div style="font-size:9.5px;font-family:'IBM Plex Mono',monospace;color:#6b6558;margin-top:6px;">2022</div></div>
<div style="flex:1;display:flex;flex-direction:column;align-items:center;"><div style="font-size:9.5px;font-family:'IBM Plex Mono',monospace;color:#1a2332;margin-bottom:4px;">19,326</div><div style="width:70%;height:24px;background:#b5432a;border-radius:3px 3px 0 0;"></div><div style="font-size:9.5px;font-family:'IBM Plex Mono',monospace;color:#6b6558;margin-top:6px;">2023</div></div>
<div style="flex:1;display:flex;flex-direction:column;align-items:center;"><div style="font-size:9.5px;font-family:'IBM Plex Mono',monospace;color:#1a2332;margin-bottom:4px;">20,358</div><div style="width:70%;height:25px;background:#b5432a;border-radius:3px 3px 0 0;"></div><div style="font-size:9.5px;font-family:'IBM Plex Mono',monospace;color:#6b6558;margin-top:6px;">2024</div></div>
<div style="flex:1;display:flex;flex-direction:column;align-items:center;"><div style="font-size:9.5px;font-family:'IBM Plex Mono',monospace;color:#1a2332;margin-bottom:4px;">22,879</div><div style="width:70%;height:29px;background:#b5432a;border-radius:3px 3px 0 0;"></div><div style="font-size:9.5px;font-family:'IBM Plex Mono',monospace;color:#6b6558;margin-top:6px;">2025</div></div>
</div>
<hr style="border:none;border-top:1px solid #ddd8cc;margin:22px 0 18px;" />
<div style="font-weight:700;font-size:16px;margin-bottom:4px;color:#1a2332;">Mortgages granted</div>
<div style="font-size:12px;color:#6b6558;margin-bottom:16px;">Only available on a comparable basis since 2020 — up 38% while foreclosures fall</div>
<div style="display:flex;align-items:flex-end;gap:6px;min-width:280px;max-width:340px;">
<div style="flex:1;display:flex;flex-direction:column;align-items:center;"><div style="font-size:9.5px;font-family:'IBM Plex Mono',monospace;color:#1a2332;margin-bottom:4px;">466,580</div><div style="width:70%;height:109px;background:#2f5d6b;border-radius:3px 3px 0 0;"></div><div style="font-size:9.5px;font-family:'IBM Plex Mono',monospace;color:#6b6558;margin-top:6px;">2020</div></div>
<div style="flex:1;display:flex;flex-direction:column;align-items:center;"><div style="font-size:9.5px;font-family:'IBM Plex Mono',monospace;color:#1a2332;margin-bottom:4px;">558,210</div><div style="width:70%;height:130px;background:#2f5d6b;border-radius:3px 3px 0 0;"></div><div style="font-size:9.5px;font-family:'IBM Plex Mono',monospace;color:#6b6558;margin-top:6px;">2021</div></div>
<div style="flex:1;display:flex;flex-direction:column;align-items:center;"><div style="font-size:9.5px;font-family:'IBM Plex Mono',monospace;color:#1a2332;margin-bottom:4px;">608,656</div><div style="width:70%;height:142px;background:#2f5d6b;border-radius:3px 3px 0 0;"></div><div style="font-size:9.5px;font-family:'IBM Plex Mono',monospace;color:#6b6558;margin-top:6px;">2022</div></div>
<div style="flex:1;display:flex;flex-direction:column;align-items:center;"><div style="font-size:9.5px;font-family:'IBM Plex Mono',monospace;color:#1a2332;margin-bottom:4px;">496,637</div><div style="width:70%;height:116px;background:#2f5d6b;border-radius:3px 3px 0 0;"></div><div style="font-size:9.5px;font-family:'IBM Plex Mono',monospace;color:#6b6558;margin-top:6px;">2023</div></div>
<div style="flex:1;display:flex;flex-direction:column;align-items:center;"><div style="font-size:9.5px;font-family:'IBM Plex Mono',monospace;color:#1a2332;margin-bottom:4px;">547,263</div><div style="width:70%;height:128px;background:#2f5d6b;border-radius:3px 3px 0 0;"></div><div style="font-size:9.5px;font-family:'IBM Plex Mono',monospace;color:#6b6558;margin-top:6px;">2024</div></div>
<div style="flex:1;display:flex;flex-direction:column;align-items:center;"><div style="font-size:9.5px;font-family:'IBM Plex Mono',monospace;color:#1a2332;margin-bottom:4px;">643,448</div><div style="width:70%;height:150px;background:#2f5d6b;border-radius:3px 3px 0 0;"></div><div style="font-size:9.5px;font-family:'IBM Plex Mono',monospace;color:#6b6558;margin-top:6px;">2025</div></div>
</div>
<div style="font-size:10.5px;color:#6b6558;margin-top:16px;">Source: INE, Mortgage Statistics (HPT) and Mortgage Foreclosure Statistics (EH). Retrieved via servicios.ine.es.</div>
</div>
The national headline is already counterintuitive: the two series move in opposite directions. More mortgage credit isn't translating into more foreclosures — but that aggregated headline hides exactly the kind of territorial difference that only shows up once you drill down to province level, which is where the actor genuinely surfaces something Google has no index of.
### The Ranking You Rarely Find Already Published
Computing the foreclosure-to-mortgage ratio for all 52 provinces in 2024 produces this:
<div style="border:3px solid #000;border-radius:12px;padding:22px 20px 18px;background:#fff;margin:26px 0;">
<div style="font-family:'IBM Plex Mono',monospace;font-size:11px;letter-spacing:.08em;text-transform:uppercase;color:#6b6558;margin-bottom:4px;">Foreclosure / mortgage ratio · 2024</div>
<div style="font-weight:700;font-size:16px;margin-bottom:16px;color:#1a2332;">Foreclosures per 100 new mortgages, by province</div>
<div style="font-family:'IBM Plex Mono',monospace;font-size:11px;font-weight:600;color:#b5432a;letter-spacing:.05em;margin-bottom:10px;">HIGHEST RATIO</div>
<div style="display:flex;align-items:center;gap:10px;margin-bottom:7px;"><div style="width:130px;flex-shrink:0;font-size:12px;">Cantabria</div><div style="flex:1;background:#ece8dd;border-radius:4px;height:13px;overflow:hidden;"><div style="width:100.0%;height:100%;background:#b5432a;"></div></div><div style="width:52px;text-align:right;font-size:12px;font-family:'IBM Plex Mono',monospace;font-weight:600;">7.31%</div></div>
<div style="display:flex;align-items:center;gap:10px;margin-bottom:7px;"><div style="width:130px;flex-shrink:0;font-size:12px;">La Rioja</div><div style="flex:1;background:#ece8dd;border-radius:4px;height:13px;overflow:hidden;"><div style="width:92.6%;height:100%;background:#b5432a;"></div></div><div style="width:52px;text-align:right;font-size:12px;font-family:'IBM Plex Mono',monospace;font-weight:600;">6.77%</div></div>
<div style="display:flex;align-items:center;gap:10px;margin-bottom:7px;"><div style="width:130px;flex-shrink:0;font-size:12px;">Alicante/Alacant</div><div style="flex:1;background:#ece8dd;border-radius:4px;height:13px;overflow:hidden;"><div style="width:89.2%;height:100%;background:#b5432a;"></div></div><div style="width:52px;text-align:right;font-size:12px;font-family:'IBM Plex Mono',monospace;font-weight:600;">6.52%</div></div>
<div style="display:flex;align-items:center;gap:10px;margin-bottom:7px;"><div style="width:130px;flex-shrink:0;font-size:12px;">Girona</div><div style="flex:1;background:#ece8dd;border-radius:4px;height:13px;overflow:hidden;"><div style="width:87.7%;height:100%;background:#b5432a;"></div></div><div style="width:52px;text-align:right;font-size:12px;font-family:'IBM Plex Mono',monospace;font-weight:600;">6.41%</div></div>
<div style="display:flex;align-items:center;gap:10px;margin-bottom:7px;"><div style="width:130px;flex-shrink:0;font-size:12px;">Murcia</div><div style="flex:1;background:#ece8dd;border-radius:4px;height:13px;overflow:hidden;"><div style="width:87.1%;height:100%;background:#b5432a;"></div></div><div style="width:52px;text-align:right;font-size:12px;font-family:'IBM Plex Mono',monospace;font-weight:600;">6.37%</div></div>
<div style="display:flex;align-items:center;gap:10px;margin-bottom:7px;"><div style="width:130px;flex-shrink:0;font-size:12px;">Tarragona</div><div style="flex:1;background:#ece8dd;border-radius:4px;height:13px;overflow:hidden;"><div style="width:85.9%;height:100%;background:#b5432a;"></div></div><div style="width:52px;text-align:right;font-size:12px;font-family:'IBM Plex Mono',monospace;font-weight:600;">6.28%</div></div>
<div style="display:flex;align-items:center;gap:10px;margin-bottom:7px;"><div style="width:130px;flex-shrink:0;font-size:12px;">Almería</div><div style="flex:1;background:#ece8dd;border-radius:4px;height:13px;overflow:hidden;"><div style="width:82.6%;height:100%;background:#b5432a;"></div></div><div style="width:52px;text-align:right;font-size:12px;font-family:'IBM Plex Mono',monospace;font-weight:600;">6.04%</div></div>
<div style="display:flex;align-items:center;gap:10px;margin-bottom:7px;"><div style="width:130px;flex-shrink:0;font-size:12px;">Huesca</div><div style="flex:1;background:#ece8dd;border-radius:4px;height:13px;overflow:hidden;"><div style="width:79.8%;height:100%;background:#b5432a;"></div></div><div style="width:52px;text-align:right;font-size:12px;font-family:'IBM Plex Mono',monospace;font-weight:600;">5.83%</div></div>
<div style="display:flex;align-items:center;gap:10px;margin-bottom:7px;"><div style="width:130px;flex-shrink:0;font-size:12px;">Ávila</div><div style="flex:1;background:#ece8dd;border-radius:4px;height:13px;overflow:hidden;"><div style="width:79.2%;height:100%;background:#b5432a;"></div></div><div style="width:52px;text-align:right;font-size:12px;font-family:'IBM Plex Mono',monospace;font-weight:600;">5.79%</div></div>
<div style="display:flex;align-items:center;gap:10px;margin-bottom:16px;"><div style="width:130px;flex-shrink:0;font-size:12px;">Jaén</div><div style="flex:1;background:#ece8dd;border-radius:4px;height:13px;overflow:hidden;"><div style="width:76.7%;height:100%;background:#b5432a;"></div></div><div style="width:52px;text-align:right;font-size:12px;font-family:'IBM Plex Mono',monospace;font-weight:600;">5.61%</div></div>
<div style="font-family:'IBM Plex Mono',monospace;font-size:11px;font-weight:600;color:#2f5d6b;letter-spacing:.05em;margin-bottom:10px;">LOWEST RATIO</div>
<div style="display:flex;align-items:center;gap:10px;margin-bottom:7px;"><div style="width:130px;flex-shrink:0;font-size:12px;">Gipuzkoa</div><div style="flex:1;background:#ece8dd;border-radius:4px;height:13px;overflow:hidden;"><div style="width:14.0%;height:100%;background:#2f5d6b;"></div></div><div style="width:52px;text-align:right;font-size:12px;font-family:'IBM Plex Mono',monospace;font-weight:600;">1.02%</div></div>
<div style="display:flex;align-items:center;gap:10px;margin-bottom:7px;"><div style="width:130px;flex-shrink:0;font-size:12px;">Segovia</div><div style="flex:1;background:#ece8dd;border-radius:4px;height:13px;overflow:hidden;"><div style="width:17.1%;height:100%;background:#2f5d6b;"></div></div><div style="width:52px;text-align:right;font-size:12px;font-family:'IBM Plex Mono',monospace;font-weight:600;">1.25%</div></div>
<div style="display:flex;align-items:center;gap:10px;margin-bottom:7px;"><div style="width:130px;flex-shrink:0;font-size:12px;">Navarra</div><div style="flex:1;background:#ece8dd;border-radius:4px;height:13px;overflow:hidden;"><div style="width:17.5%;height:100%;background:#2f5d6b;"></div></div><div style="width:52px;text-align:right;font-size:12px;font-family:'IBM Plex Mono',monospace;font-weight:600;">1.28%</div></div>
<div style="display:flex;align-items:center;gap:10px;margin-bottom:7px;"><div style="width:130px;flex-shrink:0;font-size:12px;">Bizkaia</div><div style="flex:1;background:#ece8dd;border-radius:4px;height:13px;overflow:hidden;"><div style="width:17.5%;height:100%;background:#2f5d6b;"></div></div><div style="width:52px;text-align:right;font-size:12px;font-family:'IBM Plex Mono',monospace;font-weight:600;">1.28%</div></div>
<div style="display:flex;align-items:center;gap:10px;margin-bottom:7px;"><div style="width:130px;flex-shrink:0;font-size:12px;">Araba/Álava</div><div style="flex:1;background:#ece8dd;border-radius:4px;height:13px;overflow:hidden;"><div style="width:18.1%;height:100%;background:#2f5d6b;"></div></div><div style="width:52px;text-align:right;font-size:12px;font-family:'IBM Plex Mono',monospace;font-weight:600;">1.32%</div></div>
<div style="display:flex;align-items:center;gap:10px;margin-bottom:7px;"><div style="width:130px;flex-shrink:0;font-size:12px;">Salamanca</div><div style="flex:1;background:#ece8dd;border-radius:4px;height:13px;overflow:hidden;"><div style="width:18.9%;height:100%;background:#2f5d6b;"></div></div><div style="width:52px;text-align:right;font-size:12px;font-family:'IBM Plex Mono',monospace;font-weight:600;">1.38%</div></div>
<div style="display:flex;align-items:center;gap:10px;margin-bottom:7px;"><div style="width:130px;flex-shrink:0;font-size:12px;">Ceuta</div><div style="flex:1;background:#ece8dd;border-radius:4px;height:13px;overflow:hidden;"><div style="width:20.9%;height:100%;background:#2f5d6b;"></div></div><div style="width:52px;text-align:right;font-size:12px;font-family:'IBM Plex Mono',monospace;font-weight:600;">1.53%</div></div>
<div style="display:flex;align-items:center;gap:10px;margin-bottom:7px;"><div style="width:130px;flex-shrink:0;font-size:12px;">Teruel</div><div style="flex:1;background:#ece8dd;border-radius:4px;height:13px;overflow:hidden;"><div style="width:21.5%;height:100%;background:#2f5d6b;"></div></div><div style="width:52px;text-align:right;font-size:12px;font-family:'IBM Plex Mono',monospace;font-weight:600;">1.57%</div></div>
<div style="display:flex;align-items:center;gap:10px;margin-bottom:7px;"><div style="width:130px;flex-shrink:0;font-size:12px;">Lugo</div><div style="flex:1;background:#ece8dd;border-radius:4px;height:13px;overflow:hidden;"><div style="width:28.7%;height:100%;background:#2f5d6b;"></div></div><div style="width:52px;text-align:right;font-size:12px;font-family:'IBM Plex Mono',monospace;font-weight:600;">2.10%</div></div>
<div style="display:flex;align-items:center;gap:10px;"><div style="width:130px;flex-shrink:0;font-size:12px;">Soria</div><div style="flex:1;background:#ece8dd;border-radius:4px;height:13px;overflow:hidden;"><div style="width:2.9%;height:100%;background:#2f5d6b;"></div></div><div style="width:52px;text-align:right;font-size:12px;font-family:'IBM Plex Mono',monospace;font-weight:600;">0.21%</div></div>
<div style="font-size:10.5px;color:#6b6558;margin-top:18px;">Source: INE, HPT + EH, 2024. Ratio = registered foreclosures / mortgages granted × 100, by province.</div>
</div>
Cantabria, La Rioja, and Alicante lead with more than 6 foreclosures per 100 new mortgages in 2024. At the other end, Soria, Gipuzkoa, and Segovia sit below 1.3%. It's a good example of a figure that can easily go unnoticed until you drill down to this level of detail, cross-referencing two separate INE statistical operations, province by province, across all 52 provinces. And if you haven't seen it published as a news story or article, asking ChatGPT or Claude directly won't get you this specific figure on its own either, because the model can only draw on what's indexed.
### Why the Raw Number Misleads and the Ratio Doesn't
If you compare mortgage and foreclosure volumes directly by province, the correlation is very high (r ≈ 0.90 on 2024 data). But that correlation is almost entirely a size effect: bigger provinces have more of everything.
| Province | Mortgages 2024 | Foreclosures 2024 | Ratio |
| --- | --- | --- | --- |
| Madrid | 90,007 | 2,064 | 2.29% |
| Barcelona | 66,155 | 2,525 | 3.82% |
| Cantabria | 6,665 | 487 | 7.31% |
| Soria | 951 | 2 | 0.21% |
Madrid has more than double the absolute number of foreclosures than Cantabria (2,064 versus 487), which on its face suggests more risk. But relative to the volume of mortgages signed in each territory, Cantabria's ratio (7.31%) is more than three times Madrid's (2.29%). The raw number — the one that usually shows up indexed in press releases and articles — can lead you to read the situation the opposite way from what the ratio shows. It's another example of why it's worth drilling down to the granular data: if you settle for what's already published, it's easy to overlook the figure that actually matters.
### 🧑⚖️ For Practicing Lawyers: the Homogenized Ratio, Housing Only
The ratio above still mixes rural land, building plots, and "other uses" together with housing — on both the mortgage and the foreclosure side. For a firm that wants to measure the judicial pressure that specifically falls on housing — not rural land or a building lot — that noise distorts the reading: a province with a strong agricultural profile can rack up foreclosures on rural land while having few residential mortgages, which inflates the raw ratio without saying anything about the real pressure on family homes.
The `legaltech/ine` actor lets you rerun the cross-reference filtering both statistics by the "Naturaleza de la finca" (property type) dimension — keeping only `Viviendas` (housing) in the Mortgage Statistics and `Fincas urbanas: viviendas` (urban housing units) in the Mortgage Foreclosure Statistics — so you're comparing like with like. Applied to the same seven provinces:
| Province | Raw ratio (all property types) | Raw rank | Housing-only ratio | Homogenized rank |
| --- | --- | --- | --- | --- |
| Almería | 6.04% | 7th | 6.15% | 1st |
| Girona | 6.41% | 4th | 5.99% | 2nd |
| Murcia | 6.37% | 5th | 5.61% | 3rd |
| Alicante/Alacant | 6.52% | 3rd | 5.39% | 4th |
| Tarragona | 6.28% | 6th | 5.22% | 5th |
| La Rioja | 6.77% | 2nd | 4.50% | 9th |
| Cantabria | 7.31% | 1st | 2.21% | 35th |
*(ranks out of 52 provinces; ratio = foreclosures / mortgages × 100, calculated in both cases over the same universe — all property types or housing only)*
Cantabria, which led the raw ranking as the apparent "highest-risk" province, drops to 35th out of 52 once you isolate housing: much of its 2024 foreclosures fell on rural land, not housing, against a relatively low volume of residential mortgages. La Rioja suffers a similar drop, from 2nd to 9th. At the other end, Almería, Girona, Murcia, Alicante, and Tarragona — coastal provinces with a heavy weight of vacation housing and sales to non-residents — hold up as the provinces under the most real pressure on housing, with ratios between 5% and 6.2% even after the filter.
This is just one example of what you can build by cross-referencing these two statistics. If you want to learn how to do it yourself and dig into the INE's statistics with your own questions, follow the tutorial below.
## 🤖 Tutorial: Connect Apify to Claude and Start Cross-Referencing Mortgages and Foreclosures
Thanks to the **Model Context Protocol (MCP)**, Claude can connect to external tools like Apify. Instead of downloading INE tables and cross-referencing them by hand in a spreadsheet, you can ask Claude in natural language for the cross-reference you need and let it assemble it for you.
### **Step 1: Open Claude or ChatGPT in Your Browser**
No install needed: go straight to [Claude's connectors settings](https://claude.ai/customize/connectors) and sign in with your account, or to [ChatGPT's connectors settings](https://chatgpt.com/#settings/Connectors) if you'd rather use that. MCP connectors work the same way from the browser as they do from the desktop or mobile apps.
### **Step 2: Connect the Apify MCP (no token needed)**
You no longer need to generate and paste an API token by hand: the Apify connector is authorized directly with OAuth from within Claude.
1. Go to [Customize → Connectors](https://claude.ai/customize/connectors).
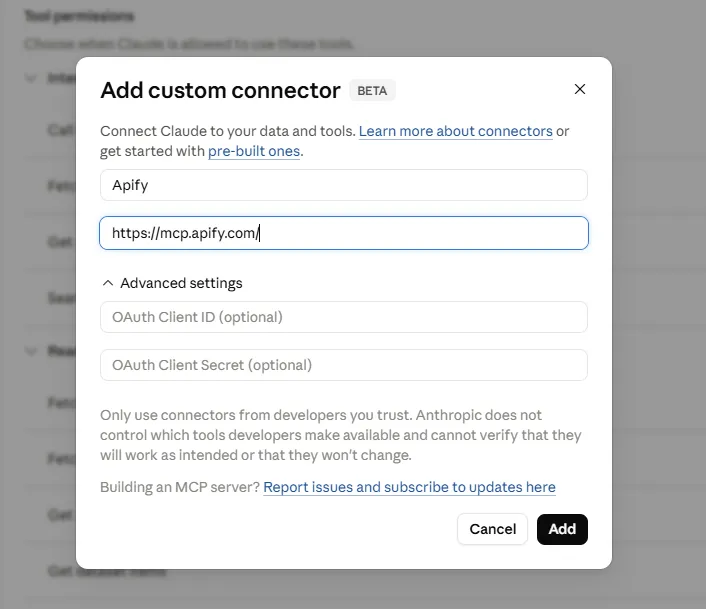
2. Click the **+** button next to Connectors and select **Add custom connector**.
3. Fill in the form with these two fields:
- **Name:** `Apify`
- **MCP Server URL:** `https://mcp.apify.com/?tools=actors,docs,runs,storage,tasks,legaltech/cendoj,legaltech/hacienda,legaltech/tribunal-constitucional,legaltech/tjue,legaltech/fiscalia,legaltech/catastro,legaltech/ine,legaltech/aepd`


4. Click **Add**, open the newly created connector, and click **Connect** to authorize it. If you don't have an Apify account yet, this is the moment to create one — the authorization window will prompt you, and the free plan includes enough monthly usage credits to run the actor.
<br>
<a href="https://console.apify.com/sign-up?fpr=legaltech" target="_blank" rel="noopener noreferrer" style="display: inline-block; padding: 10px 20px; font-size: 16px; font-weight: bold; text-align: center; text-decoration: none; color: #ffffff; background-color: #6B46C1; border-radius: 8px;">
Create a Free Apify Account
</a>
<br>
5. To enable the connector in a conversation, click **+** in the chat, hover over **Connectors**, and toggle on **Apify**.
With this done, you now have access to every LegalTech actor from Claude: `legaltech/ine`, `legaltech/hacienda`, `legaltech/cendoj`, and many more.
> 💬 **Prefer ChatGPT?** The same Apify MCP works the same way in ChatGPT: turn on [Developer mode](https://chatgpt.com/#settings/Connectors/Advanced), create an app from [Settings → Connectors](https://chatgpt.com/#settings/Connectors) with the name `Apify`, URL `https://mcp.apify.com/?tools=actors,docs,runs,storage,tasks,legaltech/cendoj,legaltech/hacienda,legaltech/tribunal-constitucional,legaltech/tjue,legaltech/fiscalia,legaltech/catastro,legaltech/ine,legaltech/aepd`, and **OAuth** authentication, authorize it, and you can use `legaltech/ine` by typing `@Apify` in the chat. You'll find the full walkthrough in our guide [How to Use the Apify MCP in ChatGPT](https://www.legaltechnologybootcamp.com/en/blog/chatgpt-apify-mcp-conectores-juridicos/).
> 📱 **Bonus:** Once the connector is set up on your computer, you can also use it from the **Claude or ChatGPT mobile app**: the connector is tied to your account, so there's nothing left to configure. If you'd rather set it up straight from your phone, we have a screenshot-by-screenshot walkthrough (in Spanish) at [Instalar Apify en Claude](/es/instalar/).
### **Step 3: Ask About Mortgages and Foreclosures from the Chat, in Natural Language**
Once the connector is configured, open the Claude chat and confirm that Apify shows up as an available tool.

Now you can ask Claude for the full cross-reference without needing to know a single table code. For example:
> **Use the legaltech/ine actor and calculate, for each province, how many mortgage foreclosures were registered in 2024 for every 100 mortgages granted that same year**
> **Use the legaltech/ine actor and compare the trend in mortgage foreclosures against mortgages granted in Spain over the last ten years**
> **Use the legaltech/ine actor and tell me which provinces have the highest ratio of foreclosures to new mortgages in the latest available year**
> **Use the legaltech/ine actor and tell me whether my province is above or below the national average on that ratio**
> **Use the legaltech/ine actor and rerun the cross-reference filtering both statistics down to "housing" only (no rural land, building plots, or other uses), for a homogenized ratio that's more useful if what I care about is the risk to housing**
Claude will first run a semantic search to locate the Mortgage Statistics and Mortgage Foreclosure Statistics tables, inspect their dimensions to narrow down by province and period, extract the numeric data from both, and compute the cross-reference and the ratio directly in the conversation.
### **Step 4: Analyze and Cross-Reference the Data from the Chat**
Once Claude has the data, you can keep working with it without leaving the conversation:
- *Compare my province's foreclosure ratio with its neighboring provinces.*
- *Build a table showing this ratio's trend over the last five years, not just the latest figure.*
- *Has my province's ratio risen or fallen since the 2014 crisis peak?*
- *Cross this ratio with the average housing price by province and tell me if there's a relationship.*
- *Does the provincial ranking change if we leave out rural land and building plots and keep only housing?*
- *Give me the source and the exact INE table links this figure comes from, so I can cite them.*
The analysis is a conversation: you keep refining your questions, and Claude keeps answering based on the current figure it just pulled directly from the INE's API, cross-referencing in real time two statistical operations that have never been published together.
Published on Thu Aug 20 2026 00:00:00 GMT+0000 (Coordinated Universal Time) by Miguel Gonzalez Herrera
Before diving in, a caveat: the legaltech/ine actor isn’t a strictly “legal” connector — it doesn’t query case law, legislation, or legal databases, but official statistics from Spain’s National Statistics Institute (INE). Still, having direct access to that social and economic data is also an advantage for anyone practicing law. Legal reality is, almost always, the consequence of a prior social reality: a mortgage foreclosure doesn’t appear out of nowhere — it appears because a given territory signed a large number of mortgages during an expansion period, and some of them later stopped being paid. Understanding that statistical backdrop — how many mortgages are behind it, how it evolves, which provinces concentrate the foreclosures — gives context to a specific case or legal problem that no legal search engine will give you.
Every month, Spain’s National Statistics Institute (INE) publishes two separate statistics: mortgages granted (how many are signed) and mortgage foreclosures (how many end up in a judicial procedure). Each lives in its own statistical operation, with its own tables and its own codes. Cross-referencing them — by province, by year, working out how many foreclosures get registered for every new mortgage in a region — isn’t something you can ask a search engine for: it’s a calculation you have to assemble yourself, table by table. In this guide you’ll see how the Apify MCP, connected to Claude, does that cross-reference for you — and we’ll use the INE’s own data to build the charts in this article.
📊 What Does the legaltech/ine Actor Do (and What Isn’t It For)?
The legaltech/ine actor is a natural-language semantic layer on top of the INE’s full catalog, including the Mortgage Statistics (HPT) and the Mortgage Foreclosure Statistics (EH). The workflow always follows the same steps:
Search for the table or statistical operation from your question, combining the actor’s internal catalog with the INE’s own search engine.
Inspect that table’s dimensions (province, property type, holder type, period…) and the values available for each one.
Filter and extract the numeric data, with stable links back to the source so you can cite it.
If you ask it how many mortgages were signed in Spain last month, you’ll get an answer, but that figure is already in the INE’s monthly press release and in dozens of financial outlets that summarize it the same day — that’s not where the actor adds the most value. Where it really shines is the cross-reference nobody has done for you: taking the mortgage table and the foreclosure table, aligning them by province and year, and computing a ratio that’s much harder to find already published because it requires combining two separate statistical operations.
🔍 The Real Use Case: A Ratio You’ll Rarely Find Already Calculated
The starting question is this:
In 2024, how many mortgage foreclosures were registered in each province for every 100 mortgages granted that same year?
This figure is hard to find already worked out by province. Media coverage sticks to national headlines (“mortgage foreclosures fall X% year-on-year”) or, at best, a one-off ranking using whatever data was available the year the article was written. But the ratio of foreclosures per 100 new mortgages, province by province and updated to the latest available data, is a good example of a figure you can only get by cross-referencing two INE tables that don’t share an operation or a code:
1. Filtering the Mortgage Statistics table by province and summing the twelve monthly series for 2024 gives you the number of mortgages granted.
2. Filtering the Mortgage Foreclosure Statistics table with the same province and year filter gives you the number of foreclosures initiated and registered in the property registry.
3. Dividing the second figure by the first, province by province, produces a number that’s in no article anywhere: the relative weight of foreclosure against new credit in each territory.
Note: mortgages and foreclosures are counted in the same time window (2024 against 2024), but no individual mortgage is tracked over the following years to see whether it ends in foreclosure — these are two independent counts for the same period, not the same cohort of loans. The denominator (new mortgages) has no causal link to foreclosures: it’s only a yardstick used to normalize for the size of each province’s mortgage market, the same way you could normalize by population instead. That’s why this calculation is an indicator of litigation pressure relative to the size of that year’s mortgage market — useful for comparing provinces against each other, or the same province over time — not a delinquency rate for mortgages signed in 2024, nor a predictor of future foreclosures. And if a province’s volume of new mortgages swings a lot from one year to the next (a rate cut, say), the ratio will move for that reason alone, even if foreclosures — which trail years behind — haven’t changed.
Here’s the aggregated national series for 2014-2025 — the starting point before drilling into the provincial detail:
National series · 2014–2025
Mortgage foreclosures initiated and registered
Down 84% from the crisis peak to the 2023 low
120,539
2014
102,477
2015
73,104
2016
53,010
2017
54,764
2018
56,787
2019
34,983
2020
32,881
2021
26,306
2022
19,326
2023
20,358
2024
22,879
2025
Mortgages granted
Only available on a comparable basis since 2020 — up 38% while foreclosures fall
466,580
2020
558,210
2021
608,656
2022
496,637
2023
547,263
2024
643,448
2025
Source: INE, Mortgage Statistics (HPT) and Mortgage Foreclosure Statistics (EH). Retrieved via servicios.ine.es.
The national headline is already counterintuitive: the two series move in opposite directions. More mortgage credit isn’t translating into more foreclosures — but that aggregated headline hides exactly the kind of territorial difference that only shows up once you drill down to province level, which is where the actor genuinely surfaces something Google has no index of.
The Ranking You Rarely Find Already Published
Computing the foreclosure-to-mortgage ratio for all 52 provinces in 2024 produces this:
Foreclosure / mortgage ratio · 2024
Foreclosures per 100 new mortgages, by province
HIGHEST RATIO
Cantabria
7.31%
La Rioja
6.77%
Alicante/Alacant
6.52%
Girona
6.41%
Murcia
6.37%
Tarragona
6.28%
Almería
6.04%
Huesca
5.83%
Ávila
5.79%
Jaén
5.61%
LOWEST RATIO
Gipuzkoa
1.02%
Segovia
1.25%
Navarra
1.28%
Bizkaia
1.28%
Araba/Álava
1.32%
Salamanca
1.38%
Ceuta
1.53%
Teruel
1.57%
Lugo
2.10%
Soria
0.21%
Source: INE, HPT + EH, 2024. Ratio = registered foreclosures / mortgages granted × 100, by province.
Cantabria, La Rioja, and Alicante lead with more than 6 foreclosures per 100 new mortgages in 2024. At the other end, Soria, Gipuzkoa, and Segovia sit below 1.3%. It’s a good example of a figure that can easily go unnoticed until you drill down to this level of detail, cross-referencing two separate INE statistical operations, province by province, across all 52 provinces. And if you haven’t seen it published as a news story or article, asking ChatGPT or Claude directly won’t get you this specific figure on its own either, because the model can only draw on what’s indexed.
Why the Raw Number Misleads and the Ratio Doesn’t
If you compare mortgage and foreclosure volumes directly by province, the correlation is very high (r ≈ 0.90 on 2024 data). But that correlation is almost entirely a size effect: bigger provinces have more of everything.
Province
Mortgages 2024
Foreclosures 2024
Ratio
Madrid
90,007
2,064
2.29%
Barcelona
66,155
2,525
3.82%
Cantabria
6,665
487
7.31%
Soria
951
2
0.21%
Madrid has more than double the absolute number of foreclosures than Cantabria (2,064 versus 487), which on its face suggests more risk. But relative to the volume of mortgages signed in each territory, Cantabria’s ratio (7.31%) is more than three times Madrid’s (2.29%). The raw number — the one that usually shows up indexed in press releases and articles — can lead you to read the situation the opposite way from what the ratio shows. It’s another example of why it’s worth drilling down to the granular data: if you settle for what’s already published, it’s easy to overlook the figure that actually matters.
🧑⚖️ For Practicing Lawyers: the Homogenized Ratio, Housing Only
The ratio above still mixes rural land, building plots, and “other uses” together with housing — on both the mortgage and the foreclosure side. For a firm that wants to measure the judicial pressure that specifically falls on housing — not rural land or a building lot — that noise distorts the reading: a province with a strong agricultural profile can rack up foreclosures on rural land while having few residential mortgages, which inflates the raw ratio without saying anything about the real pressure on family homes.
The legaltech/ine actor lets you rerun the cross-reference filtering both statistics by the “Naturaleza de la finca” (property type) dimension — keeping only Viviendas (housing) in the Mortgage Statistics and Fincas urbanas: viviendas (urban housing units) in the Mortgage Foreclosure Statistics — so you’re comparing like with like. Applied to the same seven provinces:
Province
Raw ratio (all property types)
Raw rank
Housing-only ratio
Homogenized rank
Almería
6.04%
7th
6.15%
1st
Girona
6.41%
4th
5.99%
2nd
Murcia
6.37%
5th
5.61%
3rd
Alicante/Alacant
6.52%
3rd
5.39%
4th
Tarragona
6.28%
6th
5.22%
5th
La Rioja
6.77%
2nd
4.50%
9th
Cantabria
7.31%
1st
2.21%
35th
(ranks out of 52 provinces; ratio = foreclosures / mortgages × 100, calculated in both cases over the same universe — all property types or housing only)
Cantabria, which led the raw ranking as the apparent “highest-risk” province, drops to 35th out of 52 once you isolate housing: much of its 2024 foreclosures fell on rural land, not housing, against a relatively low volume of residential mortgages. La Rioja suffers a similar drop, from 2nd to 9th. At the other end, Almería, Girona, Murcia, Alicante, and Tarragona — coastal provinces with a heavy weight of vacation housing and sales to non-residents — hold up as the provinces under the most real pressure on housing, with ratios between 5% and 6.2% even after the filter.
This is just one example of what you can build by cross-referencing these two statistics. If you want to learn how to do it yourself and dig into the INE’s statistics with your own questions, follow the tutorial below.
🤖 Tutorial: Connect Apify to Claude and Start Cross-Referencing Mortgages and Foreclosures
Thanks to the Model Context Protocol (MCP), Claude can connect to external tools like Apify. Instead of downloading INE tables and cross-referencing them by hand in a spreadsheet, you can ask Claude in natural language for the cross-reference you need and let it assemble it for you.
Step 1: Open Claude or ChatGPT in Your Browser
No install needed: go straight to Claude’s connectors settings and sign in with your account, or to ChatGPT’s connectors settings if you’d rather use that. MCP connectors work the same way from the browser as they do from the desktop or mobile apps.
Step 2: Connect the Apify MCP (no token needed)
You no longer need to generate and paste an API token by hand: the Apify connector is authorized directly with OAuth from within Claude.
Click the + button next to Connectors and select Add custom connector.
Fill in the form with these two fields:
Name:Apify
MCP Server URL:https://mcp.apify.com/?tools=actors,docs,runs,storage,tasks,legaltech/cendoj,legaltech/hacienda,legaltech/tribunal-constitucional,legaltech/tjue,legaltech/fiscalia,legaltech/catastro,legaltech/ine,legaltech/aepd
Click Add, open the newly created connector, and click Connect to authorize it. If you don’t have an Apify account yet, this is the moment to create one — the authorization window will prompt you, and the free plan includes enough monthly usage credits to run the actor.
To enable the connector in a conversation, click + in the chat, hover over Connectors, and toggle on Apify.
With this done, you now have access to every LegalTech actor from Claude: legaltech/ine, legaltech/hacienda, legaltech/cendoj, and many more.
💬 Prefer ChatGPT? The same Apify MCP works the same way in ChatGPT: turn on Developer mode, create an app from Settings → Connectors with the name Apify, URL https://mcp.apify.com/?tools=actors,docs,runs,storage,tasks,legaltech/cendoj,legaltech/hacienda,legaltech/tribunal-constitucional,legaltech/tjue,legaltech/fiscalia,legaltech/catastro,legaltech/ine,legaltech/aepd, and OAuth authentication, authorize it, and you can use legaltech/ine by typing @Apify in the chat. You’ll find the full walkthrough in our guide How to Use the Apify MCP in ChatGPT.
📱 Bonus: Once the connector is set up on your computer, you can also use it from the Claude or ChatGPT mobile app: the connector is tied to your account, so there’s nothing left to configure. If you’d rather set it up straight from your phone, we have a screenshot-by-screenshot walkthrough (in Spanish) at Instalar Apify en Claude.
Step 3: Ask About Mortgages and Foreclosures from the Chat, in Natural Language
Once the connector is configured, open the Claude chat and confirm that Apify shows up as an available tool.
Now you can ask Claude for the full cross-reference without needing to know a single table code. For example:
Use the legaltech/ine actor and calculate, for each province, how many mortgage foreclosures were registered in 2024 for every 100 mortgages granted that same year
Use the legaltech/ine actor and compare the trend in mortgage foreclosures against mortgages granted in Spain over the last ten years
Use the legaltech/ine actor and tell me which provinces have the highest ratio of foreclosures to new mortgages in the latest available year
Use the legaltech/ine actor and tell me whether my province is above or below the national average on that ratio
Use the legaltech/ine actor and rerun the cross-reference filtering both statistics down to “housing” only (no rural land, building plots, or other uses), for a homogenized ratio that’s more useful if what I care about is the risk to housing
Claude will first run a semantic search to locate the Mortgage Statistics and Mortgage Foreclosure Statistics tables, inspect their dimensions to narrow down by province and period, extract the numeric data from both, and compute the cross-reference and the ratio directly in the conversation.
Step 4: Analyze and Cross-Reference the Data from the Chat
Once Claude has the data, you can keep working with it without leaving the conversation:
Compare my province’s foreclosure ratio with its neighboring provinces.
Build a table showing this ratio’s trend over the last five years, not just the latest figure.
Has my province’s ratio risen or fallen since the 2014 crisis peak?
Cross this ratio with the average housing price by province and tell me if there’s a relationship.
Does the provincial ranking change if we leave out rural land and building plots and keep only housing?
Give me the source and the exact INE table links this figure comes from, so I can cite them.
The analysis is a conversation: you keep refining your questions, and Claude keeps answering based on the current figure it just pulled directly from the INE’s API, cross-referencing in real time two statistical operations that have never been published together.
How to Use the Apify MCP with a Local Model (Ollama) to Search CENDOJ Rulings
Learn how to search Spanish CENDOJ rulings in natural language with a language model that runs on your own computer: Ollama, AnythingLLM and the Apify MCP, without sending your conversations or documents to Claude or ChatGPT.
How to Use the Apify MCP in Claude to Find Which Cadastral Parcel You Are In and Look Up Its Data
Learn how to connect the Apify MCP to Claude and use the legaltech/catastro actor to get a parcel's cadastral reference from your coordinates or an address, and look up its official data without going through the Spanish Cadastre website.
How to Use the Apify MCP in Claude to Cross-Reference Spanish Mortgage and Foreclosure Data from the INE
Learn how to connect the Apify MCP to Claude and use the legaltech/ine actor to cross-reference Spain’s Mortgage Statistics and Mortgage Foreclosure Statistics from the INE, and reach the provincial figure no article publishes.
How to Use the Apify MCP in ChatGPT to Access LegalTech Legal Connectors
Learn how to use LegalTech legal connectors from a free ChatGPT account: enable Developer Mode, add the Apify MCP (@Apify), and query Fiscalía, CENDOJ, Hacienda, Property Registry, and more directly from the chat.
How to Use the Apify MCP in Claude to Query Doctrine from the Spanish State Prosecutor Office
Learn how to connect the Apify MCP to Claude and use the legaltech/fiscalia actor to search Circulares, Instrucciones and Consultas from the Spanish State Prosecutor Office directly from the chat, simply by asking in natural language.
How to Use the Apify MCP in Claude to Query Spanish Tax Authority Administrative Doctrine
Learn how to connect the Apify MCP to Claude and use the legaltech/hacienda actor to query TEAC tax administrative doctrine, DGT binding rulings, and historical resolutions directly from the chat.
We use Google Analytics cookies to analyze traffic and improve your experience. You can accept them, reject them, or read our Privacy & Cookies policy. Privacy & Cookies.